The 4% Rule Revisited: Safe Withdrawal Rates for Modern FI
On this page
- What the Trinity Study Actually Showed
- Three Modern Realities That Complicate the Math
- The Personal Factors That Matter More Than the Number
- Dynamic Withdrawal Strategies
- How to Find Your Own Number
- The Annual Review
- Final Thought
- Next Steps
- 1. Model Your Own Withdrawal Rate
- 2. Go Deeper with the FI Architect Spreadsheet
The 4% rule is the most cited number in the financial independence community. It is also the most misapplied.
The original research was sound. The shorthand that emerged from it was not. When someone tells you “you need 25x your expenses to retire,” they are doing the math correctly but skipping the part where that math depends on assumptions that may or may not apply to your situation.
This article is about those assumptions — which ones hold up, which ones have shifted, and how to think about a withdrawal rate that actually reflects your plan.
What the Trinity Study Actually Showed
The 4% rule comes from research published in 1998 by three finance professors at Trinity University in Texas. They analyzed how different initial withdrawal rates would have performed across historical 30-year periods using a portfolio split roughly between stocks and bonds.
The headline finding: a 4% initial withdrawal rate, adjusted annually for inflation, had a 95% historical success rate over 30-year periods using US market data through the mid-1990s.
Several things get lost in the shorthand.
The study used US historical data only. The US had an exceptional run of equity returns in the 20th century — returns that are not guaranteed to repeat, and that do not describe how internationally diversified portfolios would have performed. Applying those assumptions globally or to future decades involves real uncertainty.
“Success” meant the portfolio had at least $1 remaining after 30 years. It said nothing about the margin of that success, about portfolio health in year 25, or about whether the ride was smooth or brutal.
The 30-year horizon fits traditional retirement — retire around 65, plan through age 95. If you are planning for a 40- or 50-year horizon, which is common in the FI community, the same historical data produces meaningfully lower success rates at 4%. The rule was not designed for early retirees.
A 95% success rate means a 5% historical failure rate. That is not negligible. It means that in roughly 1 out of every 20 historical retirement periods, the portfolio ran out of money before the 30-year mark. Whether that risk is acceptable depends on your flexibility and your alternatives — not on the rule itself.
None of this invalidates the 4% rule as a planning benchmark. It means understanding what it is: a starting point derived from specific historical conditions, not a law of retirement physics.
Three Modern Realities That Complicate the Math
The conditions underlying the original research have shifted in ways worth understanding.
Longer retirement horizons. If you retire at 40, you need your plan to last 50 or more years, not 30. Extended analyses consistently show that 4% produces lower success rates over 50-year horizons than over 30-year ones. This is not a reason to panic — flexibility matters far more than the specific rate — but it is a reason not to treat a 30-year benchmark as a 50-year guarantee.
Elevated equity valuations. The cyclically adjusted price-to-earnings ratio (CAPE) for US equities has been above its long-term historical average for most of the past decade. CAPE is not a reliable short-term timing tool, but research by Kitces, Pfau, and others consistently shows that starting valuations at the time of retirement correlate with withdrawal rate sustainability over the following 30 years. Retiring into an expensive market reduces the margin for error. It does not eliminate the margin, but it narrows it.
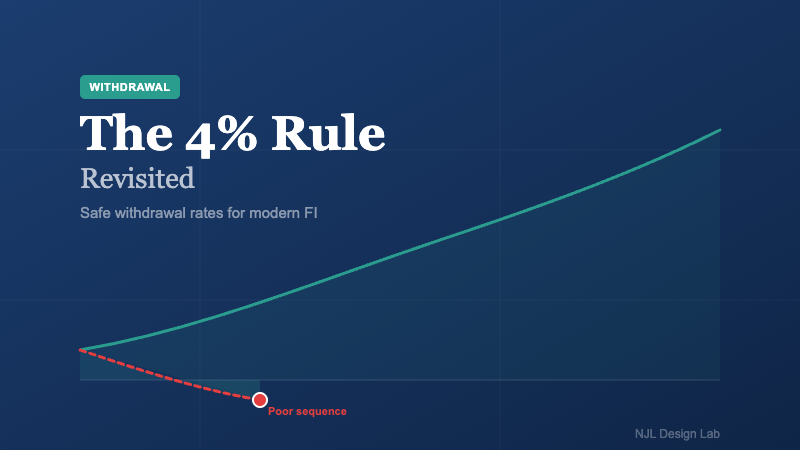
Sequence of returns risk. The average return over 30 years matters less than the order of those returns during the withdrawal phase. Withdrawing from a portfolio during a sustained early downturn — while the portfolio is largest and the withdrawals are most damaging — is fundamentally different from the reverse, even if the arithmetic mean return ends up the same.
Research on sequence risk shows that the first 10 to 15 years of retirement are the critical window. If you get a favorable sequence early, almost any reasonable withdrawal rate is survivable. If you get a poor sequence early, a historically “safe” withdrawal rate can create real pressure that compounds over time.
This is not primarily an argument for a lower initial rate. It is an argument for a strategy that responds to what actually happens rather than one that assumes history will cooperate.
The Personal Factors That Matter More Than the Number
The 4% rule is applied as if all retirements are structurally identical. They are not.
Spending flexibility. The single most important variable in long-term withdrawal sustainability is whether you can reduce spending in response to a poor early sequence. Research on flexible withdrawal strategies shows that even a modest ability to cut spending — 10 to 15 percent in a severe downturn — dramatically improves long-run survival rates at withdrawal rates that would otherwise be marginal.
If your retirement budget has meaningful discretionary spending — travel, dining, optional services — you have real built-in flexibility. If your budget is already at the essential baseline, that flexibility is limited, and your margin for error narrows accordingly.
Non-portfolio income. Social Security, rental income, part-time work, and pension income all affect how much your investment portfolio actually needs to generate. The withdrawal rate that matters is what your portfolio has to cover, not your total gross spending.
If your expenses are $60,000 per year and Social Security covers $24,000 of that, your portfolio only needs to cover $36,000. If that portfolio is $900,000, your effective withdrawal rate is 4.0% — not the 6.7% your total expenses against that portfolio would imply. Mixing up these two numbers is one of the most common planning errors in FI discussions.
Example: Effective Withdrawal Rate
Annual expenses
$60,000
minus Social
Security income
− $24,000
Portfolio must cover
$36,000
$36,000 ÷ $900,000 portfolio
4.0%
Effective Rate ✓
Using total expenses ($60K) against the portfolio gives 6.7% — which overstates the true withdrawal burden by 67%.
Retirement horizon and optionality. The length of your retirement matters, but so does your flexibility within it. Someone with marketable skills, a willingness to work part-time if a bad sequence develops, or geographic flexibility has real risk mitigation capacity that the math does not automatically capture. Optionality is not a formal input to a withdrawal model. But it is a genuine strategic asset.
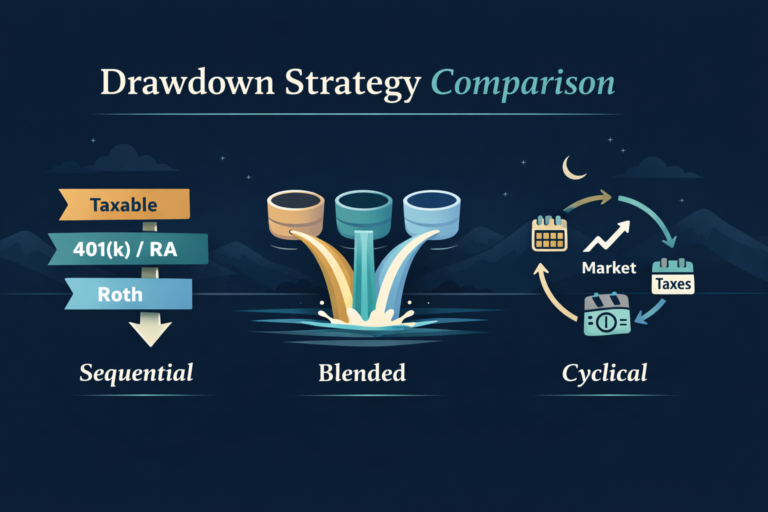
Dynamic Withdrawal Strategies
A fixed initial withdrawal rate, adjusted only for inflation regardless of what the portfolio does, is a useful planning benchmark. As an actual operating strategy, it is blunt. Several more responsive frameworks have emerged from researchers and practitioners.
The Guardrails Approach. Rather than locking in a dollar amount adjusted for inflation, the guardrails approach (associated with Guyton and Klinger) sets upper and lower bounds on the effective withdrawal rate. If market conditions push your rate above the upper guardrail, you reduce withdrawals modestly. If portfolio growth pushes it below the lower guardrail, you can increase spending.
Research on the Guyton-Klinger model shows that it supports initial withdrawal rates above 4% — sometimes meaningfully above — while maintaining strong historical success rates, precisely because it includes a mechanism to adapt. The tradeoff is spending variability, which some people find acceptable and others do not.
Life Expectancy-Based Withdrawals. Rather than targeting a fixed inflation-adjusted dollar amount, you withdraw a percentage of the current portfolio each year based on your remaining life expectancy. This is the logic behind Required Minimum Distribution rules. Withdrawals automatically compress when the portfolio shrinks and expand when it grows. The limitation is that spending becomes variable, which makes budgeting harder.
The Floor and Upside Approach. Essential expenses are covered by guaranteed or near-guaranteed income — Social Security, annuities, TIPS ladders, rental income. Discretionary spending draws from the investment portfolio. This separates the parts of your plan that cannot absorb volatility from the parts that can, and it allows the investment portfolio to be managed more aggressively because its failure does not threaten essential expenses.
How to Find Your Own Number
Your safe withdrawal rate is a function of your specific circumstances, not a universal constant. Here is a practical framework for getting to it.
Start with real expenses, separated by type. Know your essential baseline — what you need — separate from your discretionary spending — what you want. This distinction matters for flexibility analysis.
Subtract non-portfolio income. Any income that does not require selling from your investment portfolio reduces what your portfolio actually has to generate. Do this math before applying a withdrawal rate. Your relevant number is portfolio withdrawals divided by portfolio value, not total expenses divided by portfolio value.
Assess your flexibility honestly. Can you reduce spending by 15% for two or three years in a downturn without real hardship? Could you take on part-time work if a bad sequence developed in the first few years? Do you have geographic flexibility? Each of these represents genuine risk mitigation capacity that supports a higher initial rate.
Apply your horizon honestly. A 30-year horizon and a 50-year horizon are not the same problem. If you are planning for 50+ years with limited flexibility and no income floor, the conservative case for a rate of 3.5% rather than 4.0% is legitimate. If you have real flexibility and income diversification, 4.5% is defensible for many people.
The Annual Review
Any withdrawal strategy that does not include an annual review is incomplete.
Once a year, you should know your current portfolio value, your effective withdrawal rate for the year just completed (what you actually spent divided by the portfolio at year-start), and whether you are inside your planned guardrails. If your rate has drifted outside your range — up because of poor returns, down because of strong ones — that is the moment to make a small adjustment, not a crisis to react to after a decade of drift.
The point of the annual review is not anxiety. It is early awareness. A plan that is tracking below target in year three gives you options that are far easier to exercise than the options available in year twelve.
Final Thought
The 4% rule is not a promise, and it is not a ceiling. It is a historical benchmark with specific limitations that most people apply without understanding the assumptions underneath it.
Your actual safe withdrawal rate depends on your horizon, your flexibility, your non-portfolio income, and your willingness to adjust when reality diverges from the plan. For most people in the FI community, some version of 3.5% to 5% is defensible depending on how those factors stack up — which means the specific rate matters less than the system around it.
Build a plan that can adapt. Include guardrails. Do the annual review. Treat flexibility as a strategic asset rather than a fallback. That structure will serve you better than any single number.
Next Steps
1. Model Your Own Withdrawal Rate
The free FI Architect web app lets you run Monte Carlo simulations, model different withdrawal strategies, and stress-test your assumptions against historical sequences — without building your own spreadsheet from scratch.
2. Go Deeper with the FI Architect Spreadsheet
The FI Architect spreadsheet on Etsy includes pre-built models for guardrails withdrawal, life expectancy-based withdrawals, and floor-and-upside planning — along with the tax modeling and real estate analysis modules that make the full picture cleaner to work through.