
What It Really Costs to Raise a Child in the US
Part 2 of 2: This article translates family financial independence into a practical cost model. If you have not read the design framework, start with Part 1: Financial Independence with Children Is a Family Design Project.
Most parents do not need a scare piece about kids.
They need a usable starting point, a clear view of where the money goes, and a way to adapt the estimate to their own household.
The cost of raising a child in the US is not one clean number. It changes with housing, childcare, geography, health coverage, family size, and the choices a family makes along the way. The national estimates are useful, but only when you understand what they measure and what they leave out.
For families pursuing financial independence, that distinction matters. The goal is not to pretend children are inexpensive. It is to separate temporary cash-flow pressure from permanent changes to the household baseline.
The quick answer
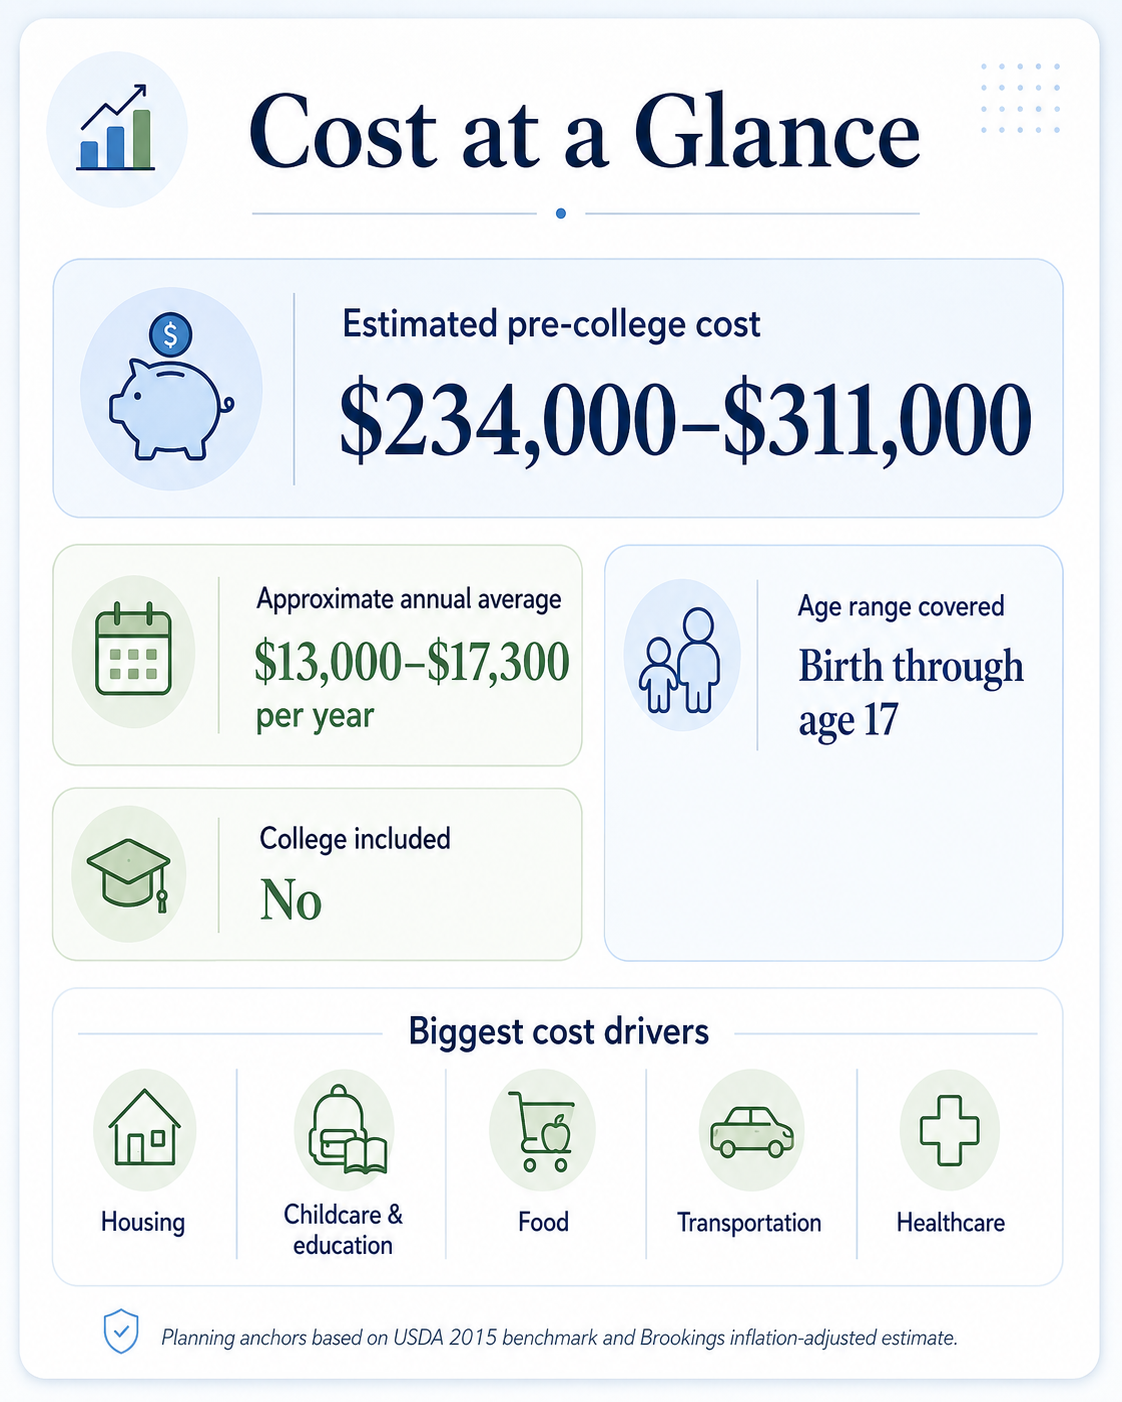
Two widely cited benchmarks put the pre-college cost of raising one child from birth through age 17 at roughly $234,000 to $311,000 for a middle-income, married-couple family with two children.
- $233,610: the USDA estimate for a child born in 2015, based on 2015 spending data.
- $310,605: a 2022 Brookings projection that applied a higher future inflation assumption to the USDA framework.
Those figures work out to historical planning averages of approximately $13,000 to $17,300 per year. Neither includes college, and neither is a current quote for your family in 2026.
How to read the headline numbers
The USDA’s 2015 report estimated that a middle-income, married-couple family with two children would spend $233,610 to raise a child born in 2015 through age 17. The report organizes spending into housing, food, transportation, clothing, healthcare, childcare and education, and miscellaneous expenses.
In 2022, Brookings recalculated the projection using a 4% inflation assumption from 2021 through 2032. That produced the $310,605 figure.
The Brookings number is a higher-inflation projection for a child born in 2015. It is not a measurement of what every child costs in 2026. Treat both figures as national anchors, then replace their assumptions with your own numbers.
What the estimate includes and excludes
| Included in the USDA framework | Usually outside the headline estimate |
|---|---|
| Housing | Pregnancy and birth |
| Food | Fertility treatment or adoption |
| Transportation | College |
| Clothing | Lost parental income |
| Healthcare | Adult-child support |
| Childcare and education | Major special-needs costs |
| Miscellaneous goods and services | Private school costs beyond the benchmark pattern |
For FI planning, the excluded costs can matter as much as the included ones. A parent who leaves work may avoid a daycare bill while giving up income, retirement contributions, Social Security credits, and career progression. A national spending estimate will not capture that trade-off for you.
Where the money goes
In the USDA benchmark, the largest categories were:
| Category | Share of total | Approximate USDA dollars |
|---|---|---|
| Housing | 29% | $67,747 |
| Food | 18% | $42,050 |
| Childcare and education | 16% | $37,378 |
| Transportation | 15% | $35,042 |
| Healthcare | 9% | $21,025 |
| Miscellaneous | 7% | $16,353 |
| Clothing | 6% | $14,017 |
The important lesson is not the exact dollar amount in each row. It is that the largest child-related decisions are often household decisions, not shopping decisions.
Housing can permanently reset the baseline
If a child does not change where you live, the marginal housing cost may be modest. If the child triggers a move, housing can become the largest change in the plan.
Suppose a family moves from a $1,600 apartment to a $2,200 apartment for more space or a different school zone. The $600 monthly difference is $7,200 per year. Over ten years, before rent increases, that decision adds $72,000 to the household’s cash outflow.
For homeowners, compare the full cost of the realistic alternatives: mortgage interest, property taxes, insurance, utilities, maintenance, HOA fees, and transaction costs. Do not count only the mortgage payment.
Childcare is often the largest temporary squeeze
Childcare prices vary sharply by county, provider type, and the child’s age. The Department of Labor’s National Database of Childcare Prices is the strongest federal starting point, but actual local provider quotes matter more than a national average.
Childcare should be evaluated as both an expense and an income-protection decision. Paying for care can preserve two incomes, retirement contributions, and career continuity. Reducing paid care can preserve family time but may reduce earnings. The right answer depends on the combined financial and family outcome.
Food rises with age
Food starts relatively small and becomes more visible in the teen years. USDA publishes monthly food-plan costs by age, which gives families a current baseline for meals prepared at home.
Transportation can turn a short-term need into long-term debt
Car seats, school logistics, activities, and teen driving all add cost. The biggest mistake is assuming that a baby automatically requires a larger or more expensive vehicle. A permanent car payment, higher insurance, depreciation, and maintenance can outlast the stage that created the purchase.
Healthcare needs a household-specific calculation
Start with the difference between your current employee premium and the family-coverage premium. Then add the deductible, out-of-pocket maximum, dental, vision, prescriptions, and any recurring care.
The 2025 KFF Employer Health Benefits Survey found average family premiums of $26,993, with workers contributing $6,850 on average. Those are employer-plan averages, not the incremental cost of adding one child, so your benefits documents remain the source of truth.
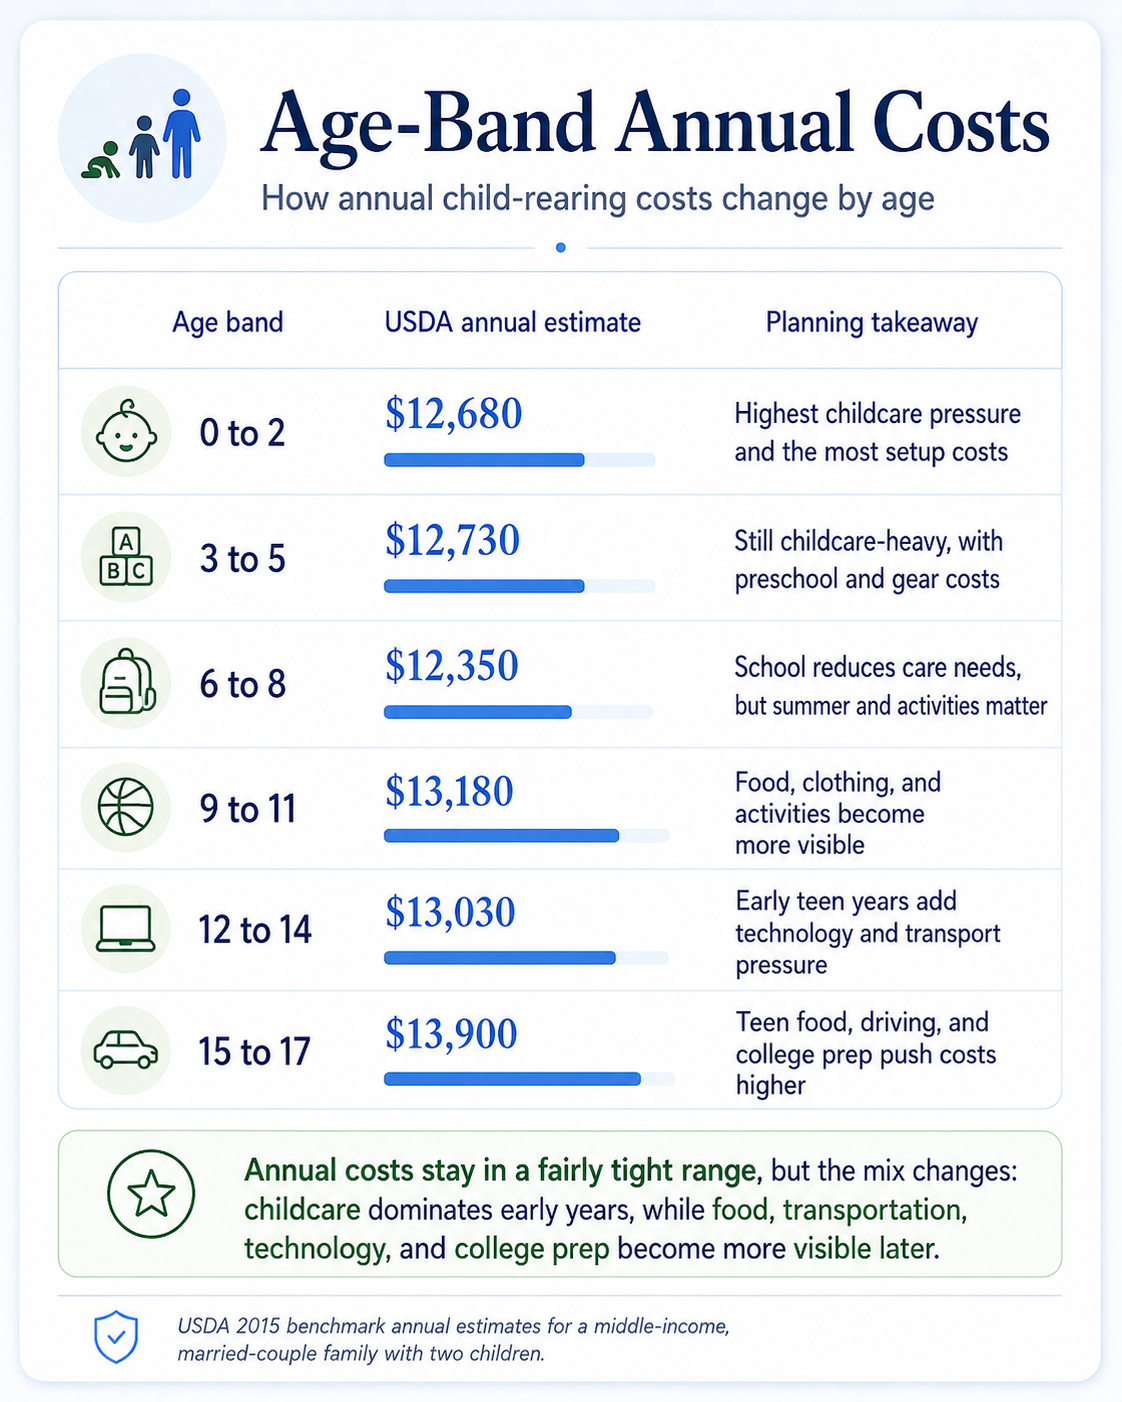
Costs change by age
A lifetime total hides the cash-flow pattern. The USDA’s historical age-band estimates stayed within a relatively narrow range, but the mix changed:
- Birth through age 5: childcare, healthcare, gear, and possible housing or work changes create the most concentrated pressure.
- Ages 6 through 11: full-time care may decline, while food, summer care, activities, and school expenses become more visible.
- Ages 12 through 17: food, transportation, technology, activities, and college preparation can push costs higher again.
For FI families, the age pattern matters because temporary costs should not always be treated like permanent lifestyle spending. A five-year daycare bill and a thirty-year mortgage increase require different planning responses.
How geography changes the budget
Your household is local even when the headline estimate is national. Urban, suburban, and rural families often feel pressure in different places, but these are patterns rather than fixed price bands.
| Geography | Costs commonly amplified | What to price locally |
|---|---|---|
| Urban | Housing, childcare, parking, and insurance | A family-sized rental, infant and preschool care, parking, and transit versus car ownership |
| Suburban | Commuting, vehicle ownership, childcare, and activity logistics | Number of vehicles, annual mileage, before- and after-school care, and school or activity travel |
| Rural | Mileage, vehicle wear, and access to care and services | Distance to childcare, healthcare, schools, groceries, activities, and family support |
An urban household may pay more for housing and childcare while avoiding a second vehicle. A suburban household may find moderate housing but carry two cars and long activity routes. A rural household may pay less for housing while spending more time and money reaching childcare, healthcare, and schools.
Use HUD Fair Market Rents for a standardized local rental benchmark and the Department of Labor’s county-level childcare database as a starting point. Then replace those benchmarks with current provider quotes, your health-plan documents, and the transportation pattern your family would actually use. Local inputs are more useful than generic city rankings.
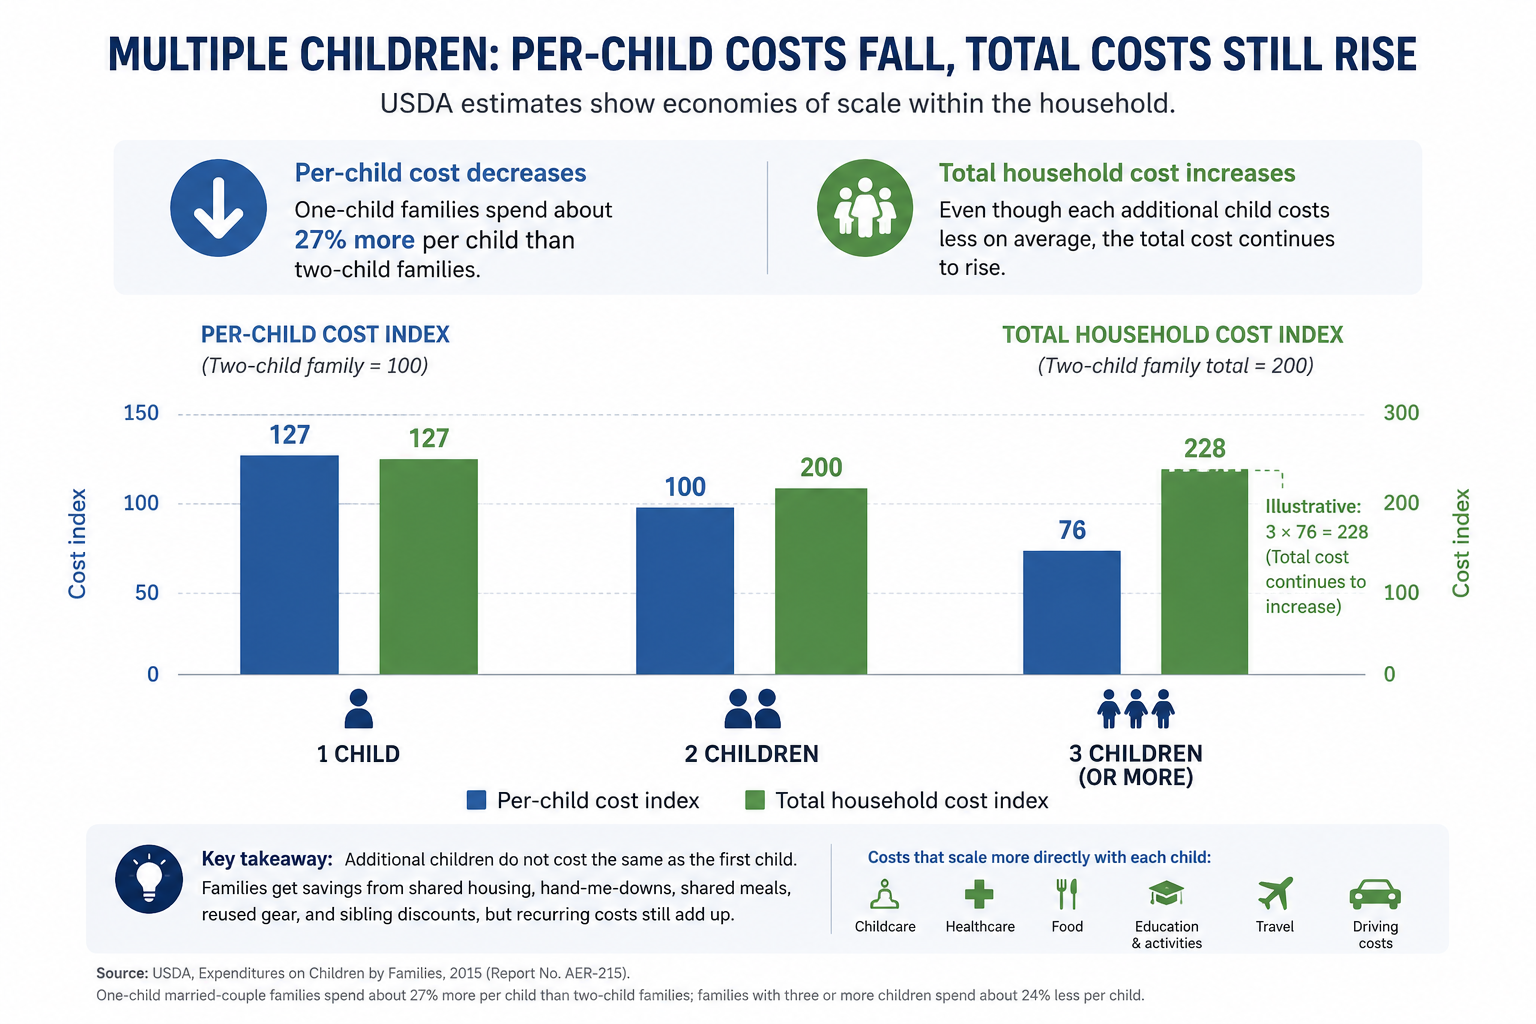
More children cost more, but not dollar-for-dollar
The first child often creates the largest setup shock. Housing, baby gear, work schedules, insurance, and transportation may all change at once. Some of that infrastructure can be shared by later children.
USDA found that one-child married-couple families spent approximately 27% more per child than comparable two-child families. Families with three or more children spent approximately 24% less per child than two-child families. Shared bedrooms, hand-me-downs, reused gear, and larger food purchases create real economies of scale.
But lower spending per child does not mean lower total household spending. Childcare, healthcare, food, travel, activities, and future education still rise. Two children in daycare at the same time can produce a much larger monthly squeeze even when lifetime cost per child is lower.
Gross cost is not always net cost
Tax credits and workplace benefits can reduce the net cost for eligible families, but the rules interact and change over time.
- For 2026, the federal exclusion for employer-provided dependent care assistance, including a dependent care FSA, is generally capped at $7,500, or $3,750 for married employees filing separately.
- The Child and Dependent Care Credit may apply to eligible work-related care expenses. Employer-provided dependent care benefits can reduce the expenses available for the credit, so families should not assume they receive both benefits on the same dollars.
- The Child Tax Credit is worth up to $2,200 per qualifying child for 2026, subject to eligibility and income rules.
- A 529 plan does not reduce the day-to-day cost of raising a child. Its primary federal benefit is tax-free growth and withdrawals when used for qualified education expenses; contributions are not federally deductible.
Verify current eligibility through the IRS guidance for dependent care assistance, the Child Tax Credit, and 529 plans. This article is educational and is not individualized tax advice.
The actual FI impact
Child-related costs affect financial independence in three different ways:
| Cost type | Examples | How to model it |
|---|---|---|
| Temporary cash-flow cost | Daycare, diapers, short-term leave | Model the expensive years directly instead of capitalizing them forever |
| Permanent baseline cost | Larger home, ongoing insurance, lasting transportation change | Include it in long-term annual spending and the FI target |
| Opportunity cost | Reduced earnings or investment contributions | Model both the lost contribution and the compounding it would have earned |
Consider a household spending $60,000 per year. Using a 4% withdrawal rate only as a planning shorthand, that supports a $1.5 million target. If children permanently raise the household baseline by $12,000 per year, the shorthand target rises to $1.8 million.
But a temporary $18,000 daycare bill for five years should not automatically add $450,000 to the permanent FI target. It should be modeled as a five-year cash-flow bridge. The withdrawal-rate shorthand is not a guarantee, and a full plan must account for taxes, investment risk, healthcare, timing, and the fact that some child costs end while others change form.

Build your own family-cost estimate
- Use $234,000 to $311,000 only as a historical national anchor.
- Estimate the housing difference created by the child, not the full cost of housing unless the entire amount is truly incremental.
- Collect local childcare quotes for each stage and identify years when costs overlap across children.
- Compare employee-only and family health premiums, then add realistic out-of-pocket exposure.
- Estimate food using current USDA age-based food plans.
- Separate necessary transportation changes from lifestyle upgrades.
- Add activities, education, travel, and technology according to your actual family values.
- Model lost income and reduced investing separately from direct spending.
- Subtract tax benefits only after confirming eligibility and avoiding double counting.
- Build low, expected, and high scenarios instead of relying on one precise forecast.
Where to go next
Return to Part 1: Financial Independence with Children Is a Family Design Project whenever you need to reconnect the numbers to the family life they are meant to support.
When you are ready to model the numbers, explore FI Architect for iOS and compare how temporary costs, permanent spending changes, and different timelines affect your plan.
Educational content only. This article does not provide individualized financial, tax, investment, or legal advice. Historical estimates and planning shortcuts should be replaced with current household data before making decisions.